Kieback & Peter - Development of cluster monitoring
Sometimes saying goodbye to a cloud provider like Azure is a bit like moving out of your parents’ house: you’ve lived comfortably for years, a lot has been taken off your hands, but at some point you realize – it’s time to stand on your own two feet. Especially when the monthly bill gets bigger and bigger.
One of our customers was facing precisely this threshold: out of the Azure world and into a provider-independent Kubernetes infrastructure. And with a goal that is as simple as it is challenging: in-house cluster monitoring that is powerful, automated and affordable.
Sounds ambitious? It is. But as is so often the case, the key to success lies in a clear structure – and a healthy dose of pragmatism.
Initial situation
The customer had been running its productive container workloads on an Azure-managed Kubernetes service (AKS) for several years. Monitoring and logging were implemented using the typical Azure tools such as Azure Monitor, Log Analytics and Application Insights – convenient, well integrated, but increasingly expensive.
What initially looked like a good deal became a cost trap over time: the data volumes increased, as did the number of users – and the bills grew proportionally. At the same time, there was a desire to make the architecture more independent. Azure was convenient, but also a technological dead end in terms of flexibility.
The decision was made: out of the comfort zone and into our own infrastructure. The most important premise here – monitoring and logging should run entirely in the cluster, without dependencies on external services.
Implementation
First of all, there were a few strategic questions: Which tools make sense at all? How complex can the setup be? And how can the whole thing be automated in such a way that you are not back in the same place in a few months?
1
Tool evaluation
We started with a structured evaluation of possible components for an internal monitoring and logging system. The options included Prometheus, Grafana, Loki, ElasticSearch, Kibana, KubeCost, Fluent Bit, Logstash and some commercial offerings.
After several proof-of-concepts and a somewhat heated workshop entitled “Who actually still needs Kibana?”, the choice fell on a tried-and-tested stack:
Grafana for dashboards and visualization
ElasticSearch + Logstash for centralized logging and flexible analysis
KubeCost for precise cost recording in the cluster
Why no Prometheus? Because the customer’s focus was not on metrics, but on logs, finances and an operational overview – and because Grafana cuts a solid figure even without Prometheus.
2
Infrastructure with Terraform
The entire infrastructure was built using Terraform and modular IaC principles. No manual clicking, no “quick test” in the web interface. Everything is reproducible, versionable and maintainable.
We created our own Terraform modules for the necessary Kubernetes resources, Helm charts and configurations – included:
ElasticSearch clusters with persistent storage
Logstash pipelines for system and application-specific logs
Grafana with LDAP connection and API-based dashboard provisioning
KubeCost integration for precise cost breakdown per namespace, pod and label
Special attention was paid to the topic of alerting: warnings should not just pop up, but should actually be actionable. This is why we defined our own alert rules, set up Slack and email integrations and defined escalation levels.
3
Dashboards and alerts
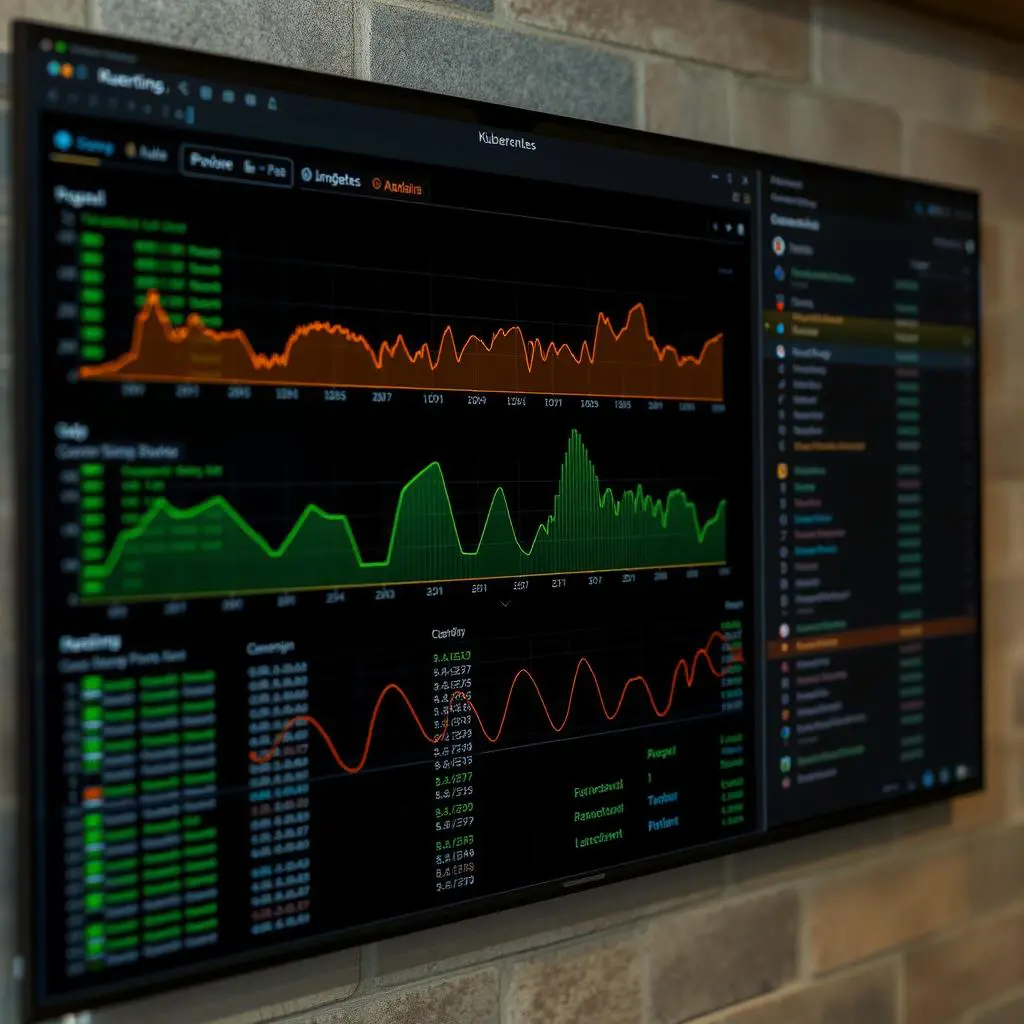
Dashboards are known to be the windows to the soul of a system. Individual panels for operations, security and finance were developed in close consultation with the customer. A few examples:
“Top Talkers”: Which pods generate the most traffic?
“Cost per team”: Who burns the budget – and why?
“Pod Flapping”: Which deployments are unstable and why?
Alarms were specifically set to threshold values where there is a real need for action – with the option to ignore them at night. After all, a monitoring system that is constantly shouting will eventually be ignored.
4
Result
The end result was a completely autonomous monitoring stack – tailored to the customer’s needs and completely independent of Azure or other cloud services.
What sounded good on paper was also convincing in practice:
High customer satisfaction: The teams received exactly the insights they needed – without unnecessary overhead.
Automated stack in just a few weeks: Thanks to the use of Terraform and Helm, the implementation times were pleasingly short. The productive infrastructure was rolled out within three weeks.
Costs drastically reduced: Compared to the previous Azure setup, the monthly costs for monitoring and logging have been reduced by more than 60% – with greater transparency at the same time.
Independence restored: The new stack runs on its own Kubernetes environment and is portable to any other cloud or on-premise provider. Technological freedom is thus regained.
The project was also a complete success from a technical point of view: clear modularization, consistent automation and close coordination with the customer resulted in an infrastructure that not only works today, but can also be expanded tomorrow.
Conclusion
Monitoring is not just a compulsory technical exercise – it is a prerequisite for stability, performance and ultimately customer satisfaction. This project shows that it is possible to build stable, powerful and cost-efficient solutions without the comfort zone of large cloud providers. You just have to dare to take the first step.
And for all those who want to take on such a project themselves: Invest time in planning, take your time to look at the tools – and don’t forget that a good dashboard is sometimes more important than the best log level.
If you are curious, you can take a closer look at the tools here:
The rest is – as is so often the case – good craftsmanship. And a little courage to be independent.